

Before you ship on terms, know if they will pay.
Oxaide checks a new buyer before you ship or grant 30 to 60 day terms: standing, ownership, charges, adverse, and a plain ship, COD-only, cap-terms, or walk call. Every line cited. S$390 prepaid: a provisional verdict in about two hours, confirmed once BizFile officers and charges land within two business days.
Know what you need? Is it real → Quick check · About to pay → Pre-deal check · GST registered → GST check
About to ship one order on terms? Start with the S$390 Pack →
UEN 201806463W since 2018 • PDPA • Uploads wiped 24h • Packs kept 90 days • Refund if a key claim is unbacked • How we handle data
Previously built with




Prior platform work, not Pack buyers.
THE ARSENAL · 8 CHECKS, EVERY JOB
NOT A BIZFILE PDF- ACRA register corpus2,124,508 rows · Oct 2026 snapshot · refreshed monthly
- IRAS GST registerLive read · prod 20 Oct 2026
- GeBIZ awards18,464 awards · feed date printed on every pack
- Sanctions screenOFAC + UN · fail-closed
- BizFile v2 pullDirectors, shareholders, charges · within 2 business days
- Second-agent checkEvery Pack re-checked by a second pass
- Human-signed Board48h · principal-signed before it ships
- Cited or refundEvery line source + page + confidence, or red flag · full refund if a key claim is unbacked
One isolated job folder per brief on a private machine, never mixed across clients. Uploads wiped in 24h, packs kept 90 days. 2 business-hour SLA, email only, no account.
Read the screen before you pay
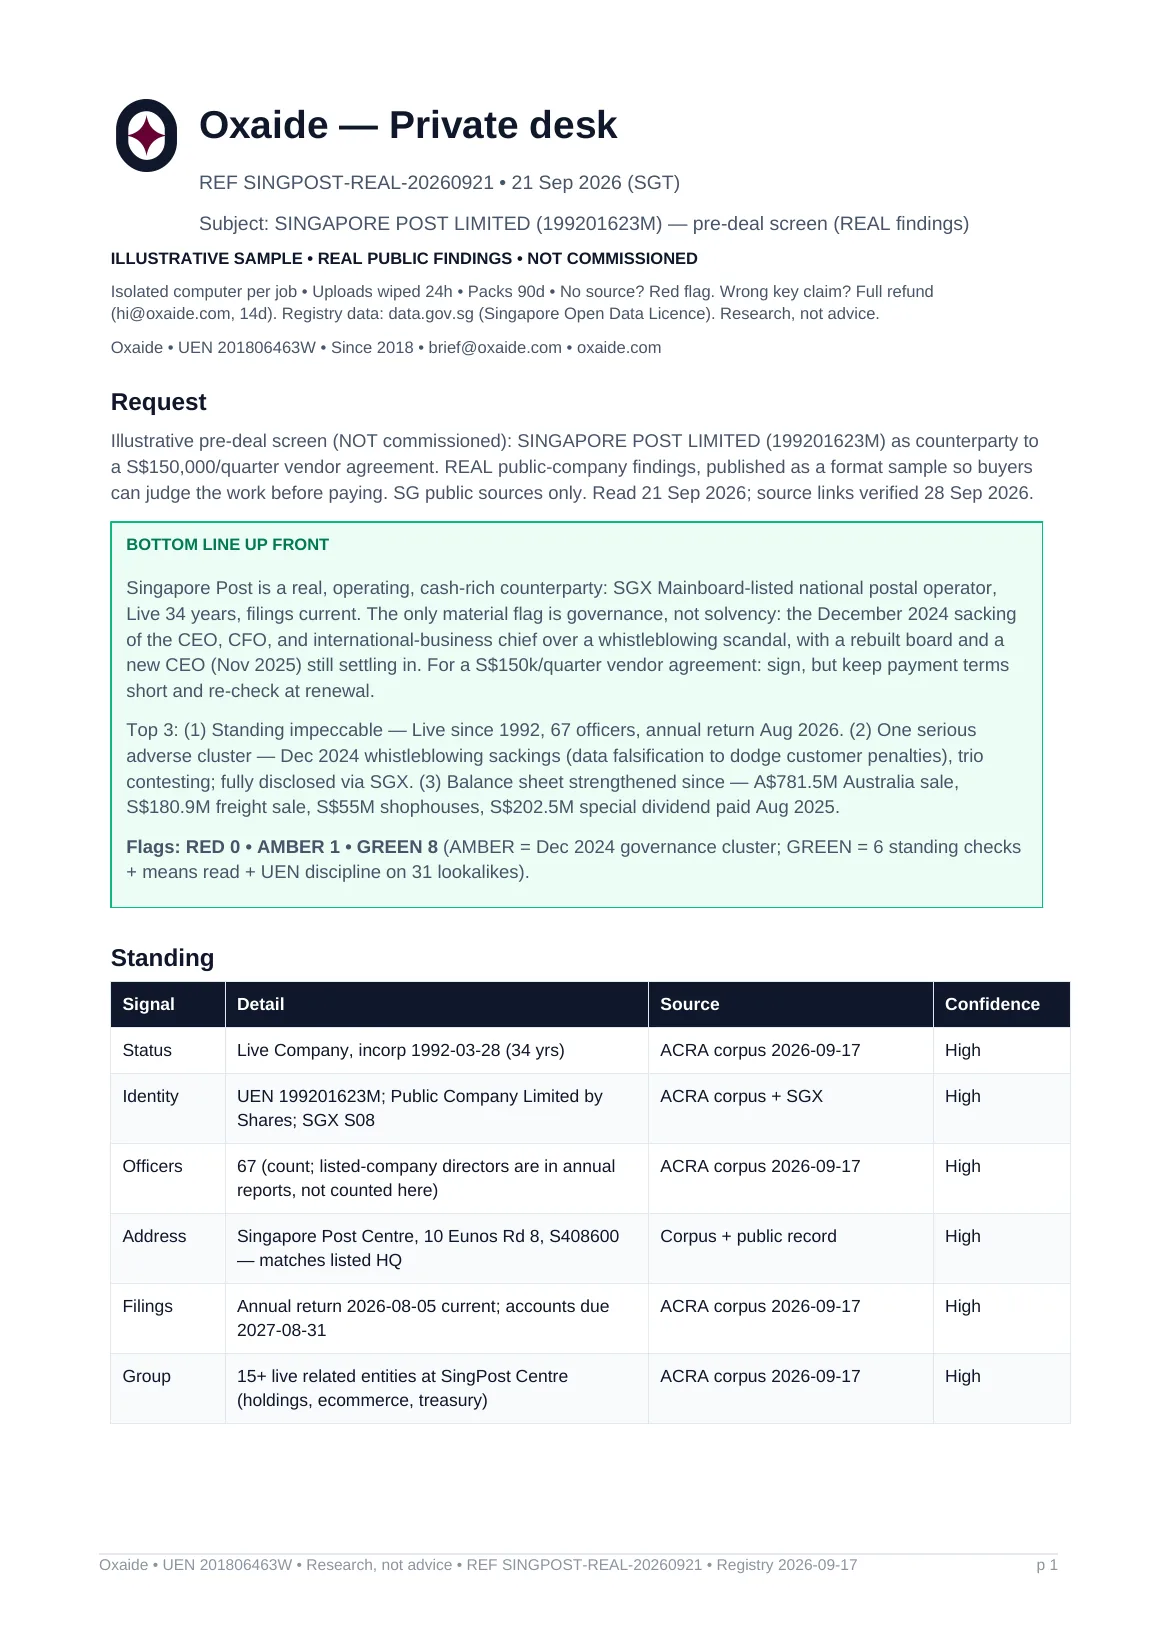
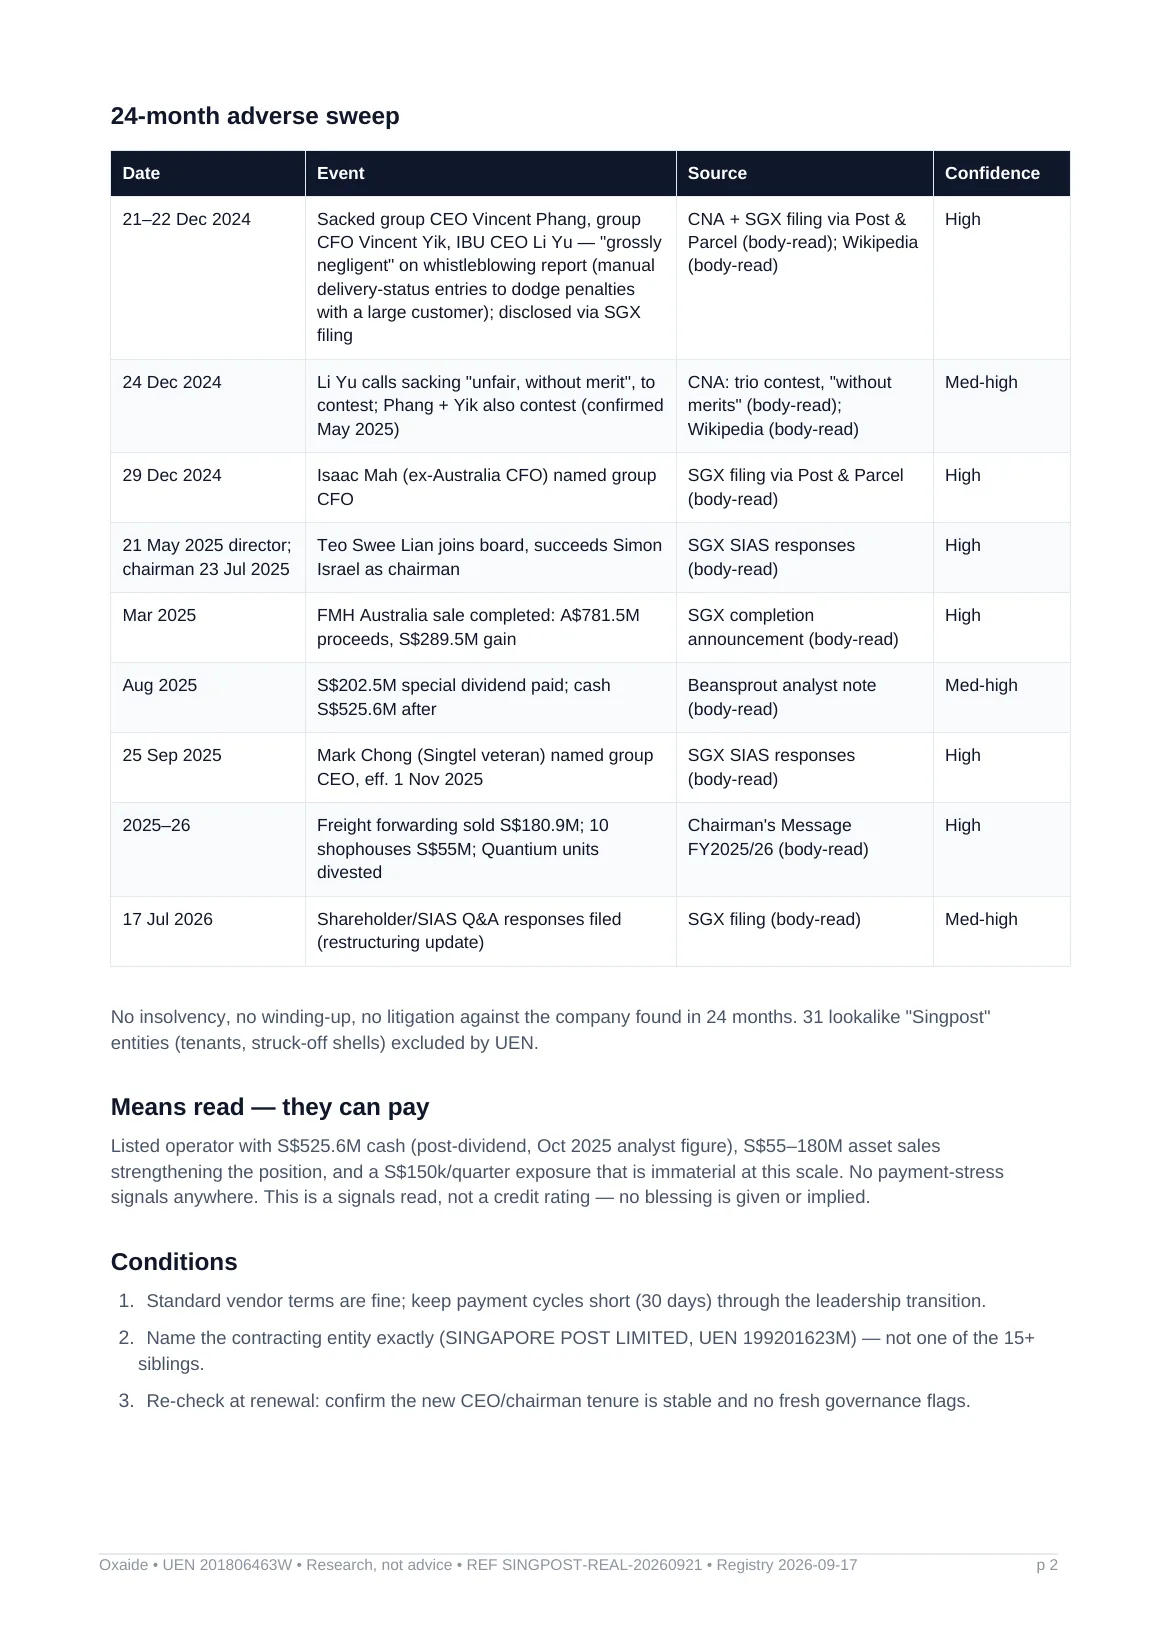
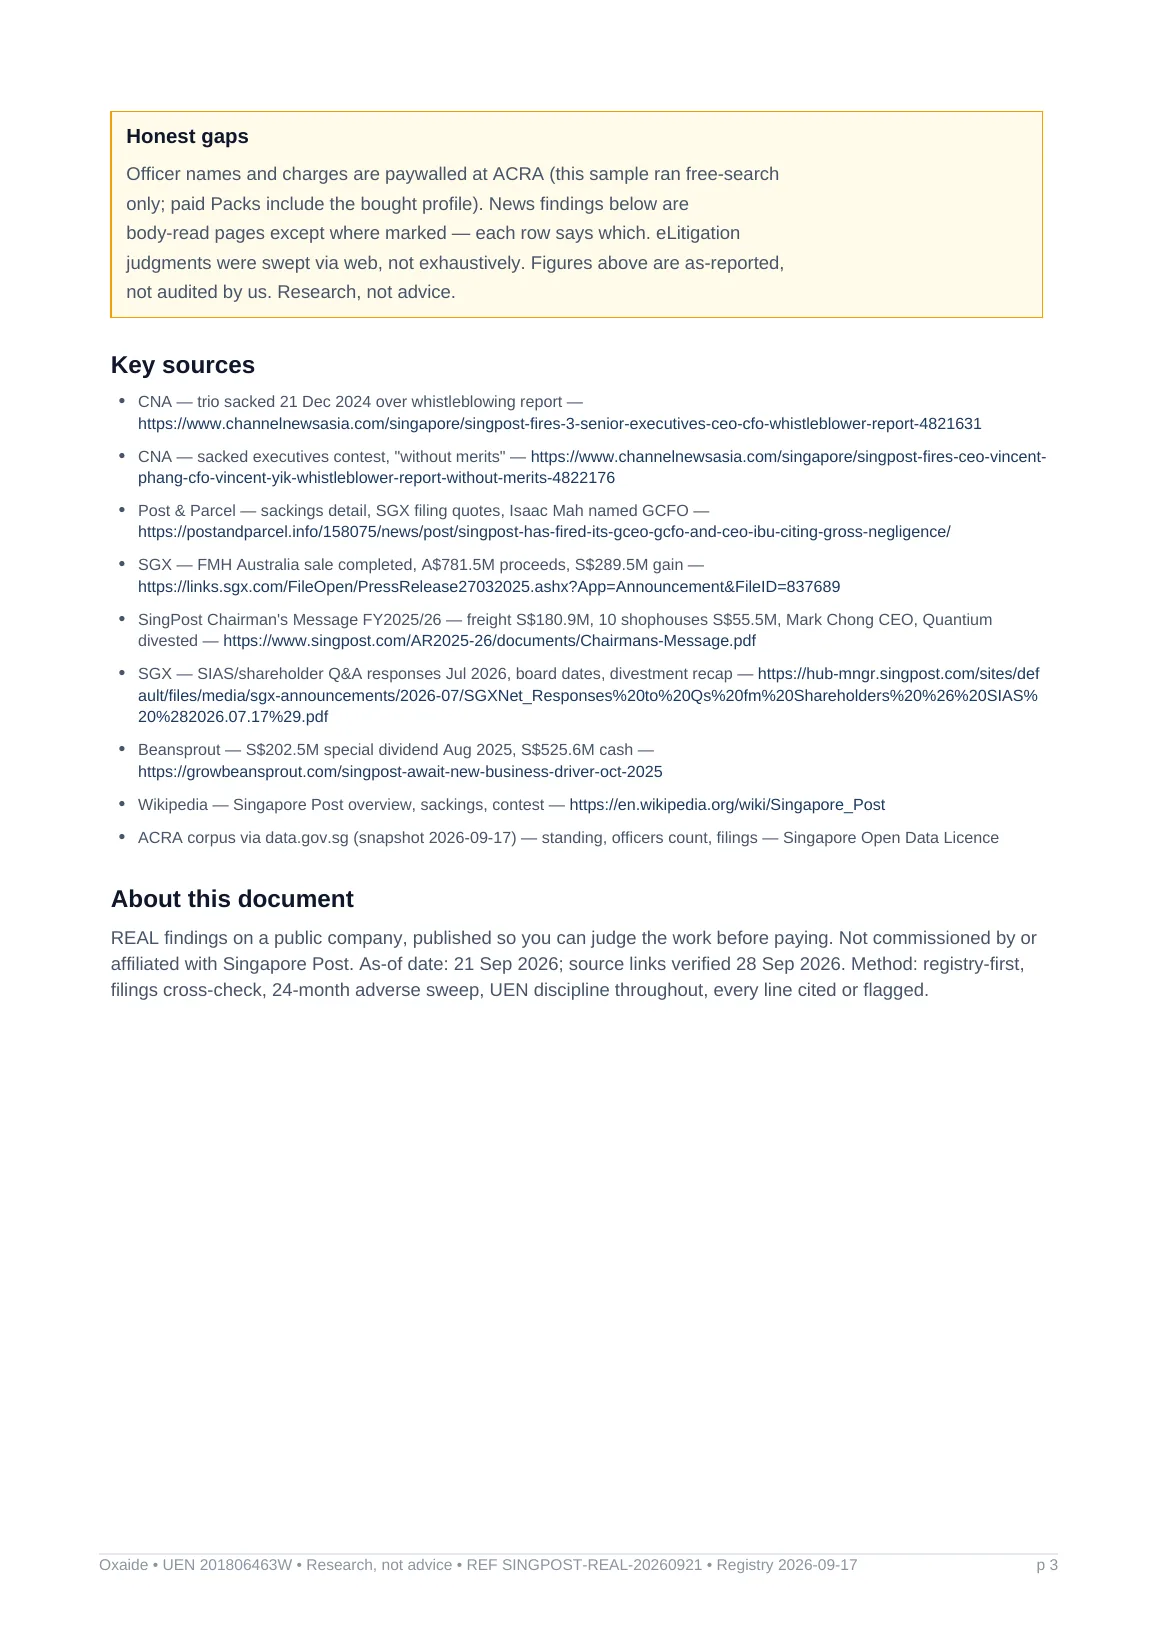
Singapore Post pre-deal screen. Every finding real, read 21 Sep 2026
Verdict: proceed on standard terms, with governance conditions. Live 34 years, one serious adverse cluster (Dec 2024 sackings) with a rebuilt board and new CEO still settling in, S$525.6M cash post-dividend (Oct 2025 figure). Judge the actual work.
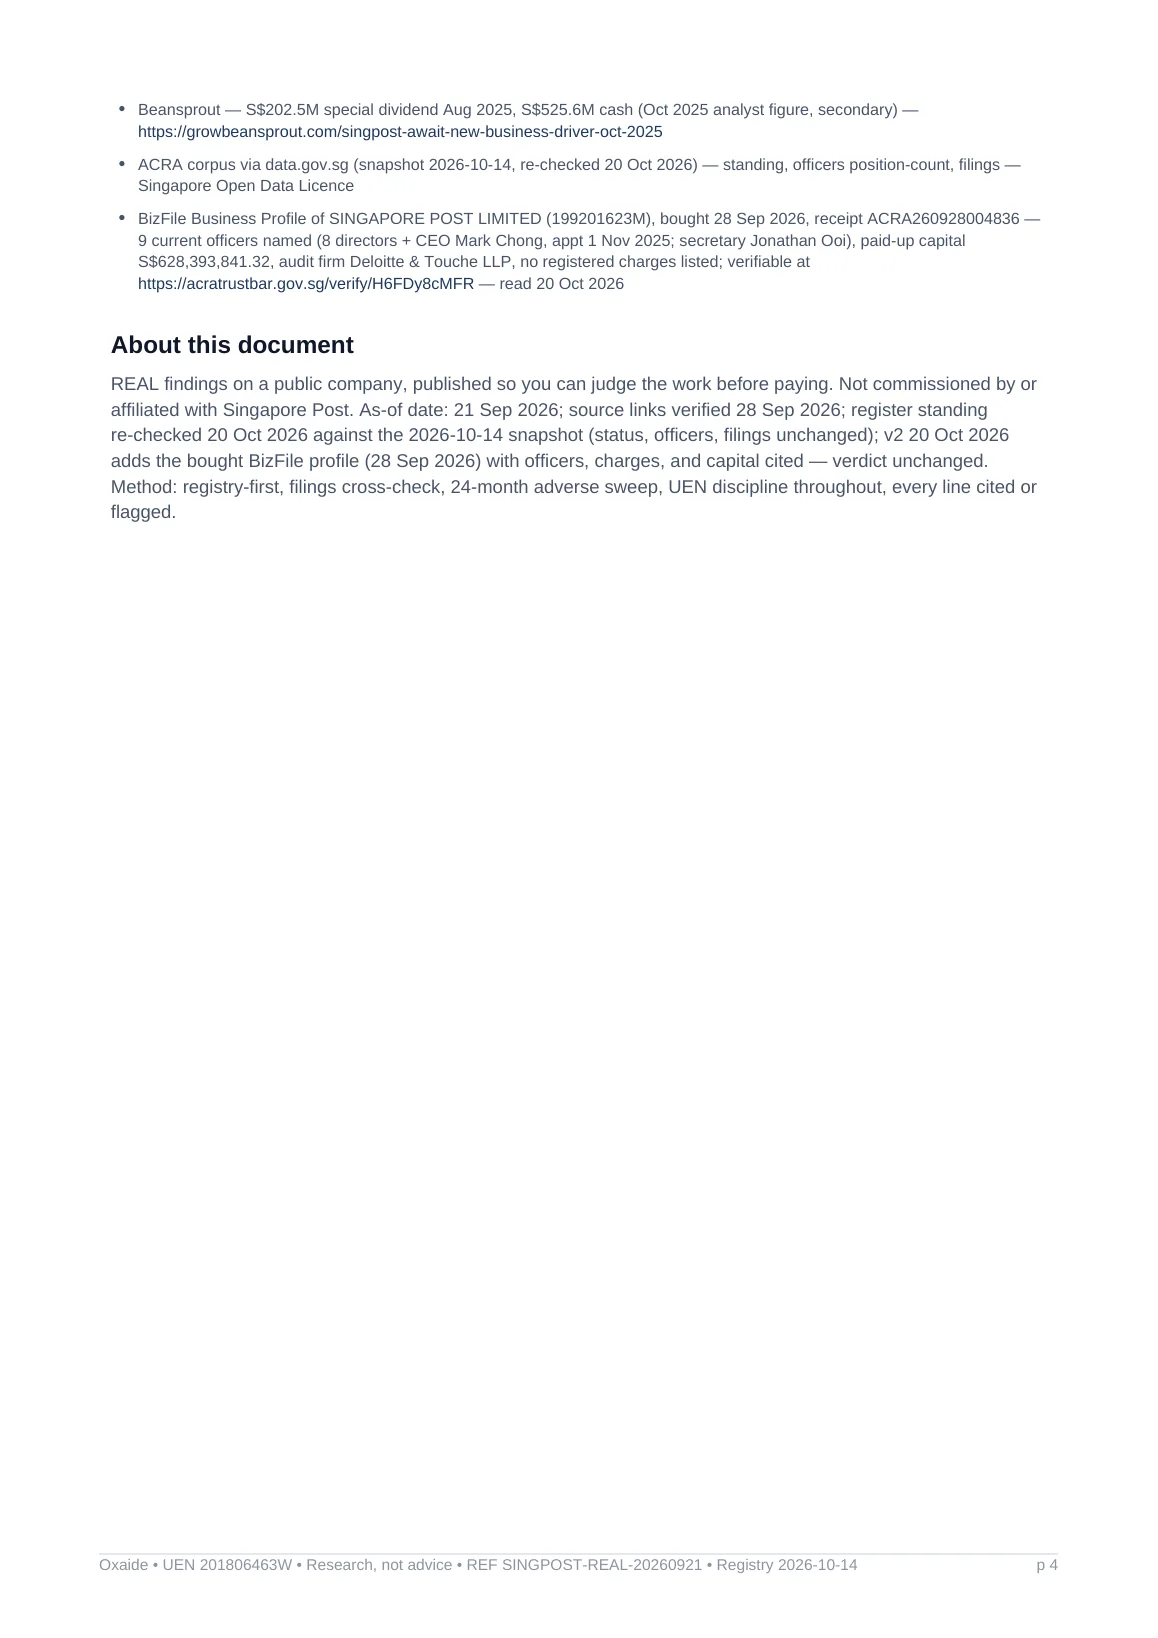
Illustrative sample on a public company, not commissioned. Findings dated 21 Sep 2026. Spot a factual error? hi@oxaide.com
Already know what you need? Describe your brief: fixed quote in minutes →
Want proof first? A real SingPost pack, every finding cited →
Finished pack? Keep it live with UEN watch. monthly re-checks from S$490/yr.
What do you need researched?
PICK → WRITE → QUOTEPick a workflow, fill 2–8 lines, trigger now.
Every brief starts as one S$390 check unless a workflow or quote says otherwise.
Same desk at every scope. Lighter (one fast answer) or boardroom-grade (human-signed deck): describe the brief and we quote it in minutes. Every pack: citations fetched back and checked, figures tied to files, UENs screened for inventions. No source? Red flag. Wrong? Refund.
Compare tiers side-by-side: pricing →
Need a starting template? 6 templates. Click to fill brief
No cold calls — everything in writing. Pay by Stripe, track by emailed link.
Questions? hi@oxaide.com. Human replies in hours.
HOW IT WORKS
BRIEF → PACK IN ~2HPacks answer one question. Watchdesk watches for twelve months.
- 01 · BRIEF
Paste 2–8 lines in the form below.
- 02 · QUOTE
One fixed price in ~15 min. We confirm scope.
- 03 · PAY
Stripe or PayNow, per job. No account, no minimums.
- 04 · PACK
PDF record + files that fit in ~2h. Every line cited.
Uploads wiped in 24h, pack kept 90 days. Wrong key claim? Full refund.
HOW WE CHECK
WHY YOU CAN TRUST IT- 01Fixed quote first
We quote one fixed price from your brief in minutes. The price never moves after you pay.
- 02An AI agent does the digging
Runs on our private build machine, separate from this site. Opens your files in your job’s own folder, never mixed with anyone else’s. Wiped after 24h.
- 03SG registry rules
ACRA, URA, GeBIZ, IRAS, data.gov.sg: public sources only, every line traced to its page. Never invented.
- 04Checked twice
A second AI agent re-checks every Pack; a human signs every Board pack before it ships.
- 05Cited or flagged
Every line shows source + page + confidence, or a red flag. Wrong key claim? Full refund.
Pains we solve: pick yours
EVERY LINE CITEDA S$120k invoice lands Friday. Can they still pay?
Pay / hold verdict + risk table in ~2h.
Pre-deal check →They owe you money. Can they pay, will they fight?
Standing, assets + adverse on the other side, cited.
Dispute brief →The rival just cut prices 20%. What is their real position?
Pricing, moat, hiring signals. Dated, cited.
Opponent diligence →Board meets Thursday on an S$Xm call. Who signs the evidence?
Human-signed board pack + workbook, 48h.
Board pack →Buying them. What is hiding in public before exclusivity?
Public-side target screen + caveat list for counsel.
Acquisition desk →Filing a trademark? One colliding name kills the application.
Names, domains, web usage, near-miss table — cited, before you file.
Trademark screen →Why owners brief Oxaide
THE DESK BETWEEN DIY AND THE BIG FOUROxaide (ox-AYD) is your aide-de-camp for evidence. You brief, we check every line, you decide — fixed price, cited pack, refund if we can't back it.
Same supplier, three depths
REAL FINDINGS • REAL FORMAT • SEP 2026Same check: “can we pay this S$80k supplier invoice?”: run at each tier on fictional Sample Trading. Figures fictional, format real.
“Live Company, GST active for this invoice date. Safe to pay, keep this page for your F5.”
One answer, UEN + GST + 2 cited sources.
“3 suppliers ranked. Sample A wins on live filings + GeBIZ awards, B flagged on nominee directors, C stale since 2024.”
Ranked table, award IDs + dates, Excel + PDF record.
“Pay Sample A in tranches, hold B pending its filing gaps, drop C. 5 risks + payment terms inside.”
10-slide deck + workbook with live formulas, every claim cited. A human signed it before it shipped.
“EDGE needs at least 30% local equity. Sample company shows 60%, pass.”
First screen free. Then S$3,000/mo.
10 cited opponent and counterparty screens a month, 2 business-hour SLA, email intake only. S$300 per screen at quota. Conflict-checked per matter. Monthly rolling, cancel by email. Pilot delivered? 15-min findings walkthrough on request. In person on closing-day, post-pilot only.
Watchdesk: we watch the registers, you get the alert
FROM S$490/YR • PREPAIDOne entity or mark, watched 12 months. Status, officers, filings, colliding names. Alert email when the monthly snapshot moves, plus a cited monthly digest. UEN watch S$490 · Supplier watch S$990 · Terms Cover S$2490.
Start a watch →OXAIDE DATA
We track the whole register: 624,271 live entities (October 2026 snapshot), S$1.2B in GeBIZ awards, 1,800+ public data pages. Sources we read: the ACRA company register (refreshed monthly), GeBIZ awards, and BCA contractor grades. Browse the data →
© 2026 Oxaide • UEN 201806463W • Since 2018
Per-job • Brief form • Support hi@oxaide.com