Question
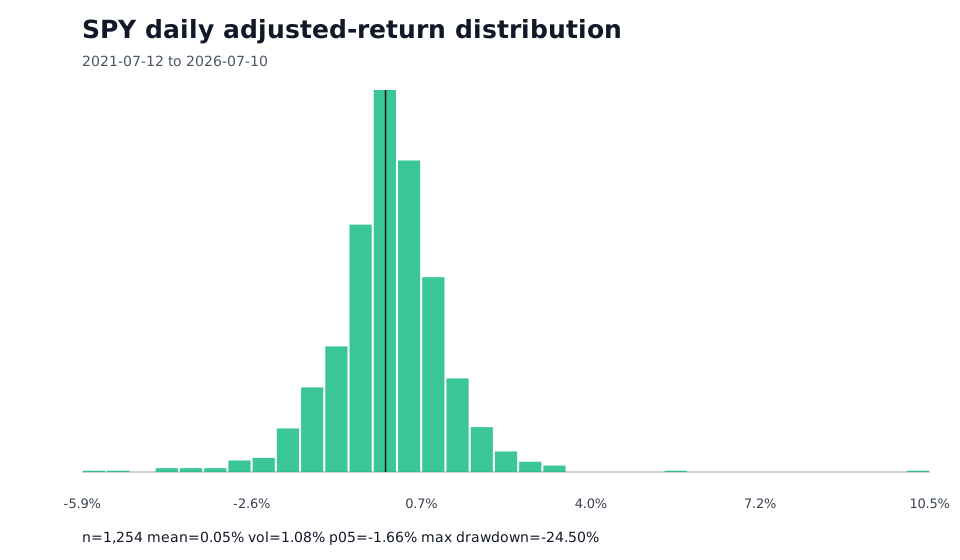
How did SPY and QQQ differ over the same five-year adjusted-close window?
Measurement contract
- Window: 12 July 2021 to 10 July 2026
- Frequency: daily observations
- Series: adjusted closing prices
- Comparison rule: like-for-like dates and metrics
- Role: SPY and QQQ are investable proxies, not the underlying indexes themselves
Core comparison
| Metric | SPY | QQQ | QQQ − SPY |
|---|---|---|---|
| Daily volatility | 1.08% | 1.44% | 0.35% |
| 1st percentile | -2.93% | -3.89% | -0.96% |
| 5th percentile | -1.66% | -2.31% | -0.64% |
| Historical expected shortfall (95%) | -2.47% | -3.25% | -0.79% |
| Positive-day ratio | 54.23% | 54.86% | 0.64% |
| Maximum drawdown | -24.50% | -35.12% | -10.62% |
Generated artifact
Short read
QQQ was more volatile than SPY over this sample, with a larger left tail, more negative expected shortfall, and a materially deeper maximum drawdown. The positive-day ratio was similar. This describes the historical sample; it does not establish a forecast or say which asset is suitable for a person.
Limitations
- Historical observations do not forecast future returns.
- Daily data does not describe intraday risk or monthly compounding behavior.
- The five-year window mixes different rate, inflation, and liquidity regimes.
- Yahoo Finance is an unofficial public provider and may revise, delay, or omit data.
- SPY is an investable S&P 500 proxy and QQQ is a Nasdaq-100 proxy.
Useful follow-up tests
- Compare rolling 63-day and 252-day volatility and expected-shortfall series.
- Split the sample into subperiods to test whether the tail-risk gap is concentrated in specific regimes.
- Add equal-weight and company-fundamental evidence before making claims about market breadth.