
Why Standard SCADA Monitoring Fails for LFP Battery Safety
The uncomfortable truth about many BESS safety stacks is that they are very good at telling you when the site is already in trouble.
They are much less reliable at telling you when the trouble is starting.
That is especially true for LFP assets.
LFP chemistry is commercially attractive because it is stable, scalable, and well suited to grid duty. It is also hard to read with simple voltage-based monitoring because the voltage curve stays relatively flat through much of the usable operating range.
So the site can be drifting into a bad state while standard summaries still look acceptable.
The Detection Gap
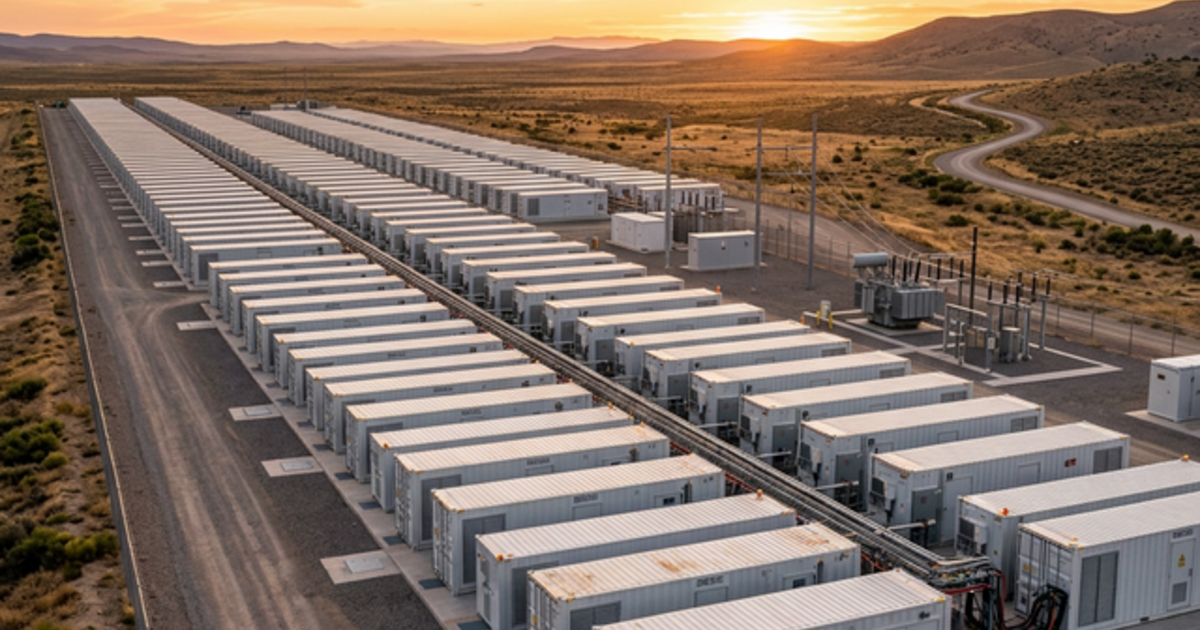
Consider a typical 50MW / 100MWh site monitored through standard SCADA and BMS summaries.
- Temperature sensors trigger at fixed thresholds. By the time surface temperature rises materially, the internal condition may already be deteriorating.
- Voltage monitoring checks whether values stay inside approved operating bands. On LFP assets, those bands are often too blunt to tell you much about early degradation.
- SOC estimation is commonly built on coulomb counting with periodic recalibration. Drift builds over time, especially when the site has not been reviewed against a fresh physical baseline.
The result is predictable. Some of the most dangerous mechanisms, including lithium plating, resistance growth, micro-short precursors, and capacity fade, can progress for weeks or months before they show up as obvious alarms.
What is dQ/dV Analysis?
Differential capacity analysis, or dQ/dV, is one of the clearest ways to look past surface telemetry and into battery behaviour.
Instead of asking only, "What voltage did the battery report?" it asks a better question:
How did charge move relative to voltage, and does that pattern still look like healthy electrochemistry?
That matters because LFP cells can hide degradation in the flat parts of the voltage curve. The absolute number may look ordinary while the shape of the response is already changing.
In a healthy LFP cell, the dQ/dV curve shows characteristic peaks corresponding to phase transitions in the cathode material. As the cell degrades:
- Peak shifting: The voltage at which phase transitions occur shifts, indicating loss of active lithium
- Peak broadening: Wider peaks indicate increased internal resistance and heterogeneous degradation
- Peak height reduction: Lower peaks reveal capacity fade at the material level
- New peak emergence: Additional peaks can indicate lithium plating or parasitic side reactions
These are not cosmetic details. They are often the earliest defensible signs that the chemistry is moving away from a healthy baseline.
Why This Requires HFT-Grade Signal Processing
The barrier is not the calculus. The barrier is field data.
Real site telemetry is noisy. Sampling rates are imperfect. Windows are incomplete. Timestamps drift. Export formats vary. And the interesting signal is often subtle.
To get reliable dQ/dV output from operational data, you need:
- High-frequency sampling alignment: Synchronizing voltage and current measurements across thousands of cells with sub-millisecond precision
- Noise filtering without signal destruction: Aggressive smoothing kills the subtle peak features. Too little smoothing produces meaningless noise. The sweet spot requires adaptive windowing based on the current operating regime.
- Real-time processing: A 100MWh facility may have 50,000+ individual cells. Processing dQ/dV for each cell in real-time, while maintaining historical baselines, requires the kind of high-concurrency architecture used in quantitative trading.
This is why naive "AI monitoring" often disappoints in practice. If the signal extraction is weak, the model sitting on top of it will still be weak.
At Oxaide, the signal-processing layer is built to preserve the physical information operators actually care about, rather than smoothing it into something that looks clean but says less.
What operators actually get from this kind of review
The point is not to produce a pretty plot for a technical appendix.
The point is to answer questions that matter commercially and operationally:
- Which blocks or modules are drifting first?
- Is the pattern consistent with plating, resistance growth, or another degradation mode?
- Is the problem isolated, systemic, or linked to duty cycle?
- How urgent is the intervention?
- Does this justify a continuous monitoring layer?
Those are decisions. A good forensic method should help the team make them.
The Forensic Audit Approach
This is where the product split matters.
Stage 1: Oxaide Verify (Diagnostic)
Oxaide Verify is the starting point.
We take historical telemetry, usually CSV exports from the BMS, SCADA historian, or data logger, and run a forensic review to establish the asset baseline.
The output identifies:
- Cells or modules showing early-stage degradation patterns
- Estimated capacity fade vs. warranty specifications
- Yield gap quantification (how much revenue is being lost to undetected inefficiency)
- Risk classification for thermal events
Stage 2: Oxaide Horizon (Permanent Safety Layer)
If the baseline shows the site needs persistent coverage, Oxaide Horizon becomes the next step.
Horizon runs continuously on infrastructure you control, processing live telemetry for ongoing anomaly detection without depending on cloud egress.
In short:
Verifyanswers, "What is happening in this asset today?"Horizonanswers, "How do we keep watching this with discipline every day after that?"
If you want the broader product framing across the platform, read Verify vs Horizon vs Sovereign: Which Oxaide Product Fits the Job?.
The Economics
For a 50MW BESS facility with a 15-year operating horizon:
- 1% undetected yield gap = approximately S$500k in lost revenue over the asset lifetime
- One thermal runaway event = S$2-10M in direct losses plus insurance premium increases
- A disciplined pilot deployment = small relative to either of the risks above
The commercial logic is not complicated. A single hidden degradation issue can cost far more than the work required to surface it properly.
Conclusion
The gap between monitoring and safety is where a lot of BESS risk still hides.
Standard monitoring tells you when something has already become obvious.
Physics-informed review gives you a chance to act while the problem is still early, interpretable, and commercially manageable.
That is why dQ/dV analysis matters. Not because it sounds advanced, but because it helps operating teams catch the chemistry change before the site turns it into a bigger event.
Related reading:
- LFP BESS Degradation: Why Your Grid-Scale Battery Is Failing Silently
- BESS Safety Monitoring Under IM8: What Singapore Grid Operators Must Now Prove
- Validation: NASA PCoE Early Anomaly Detection
If your team needs a defensible safety baseline before deciding on a permanent monitoring layer, start with a Verify forensic audit.